“I’m going to work until my next birthday,” a near retiree friend told me. We were having dinner and she’d already punted on retiring her previous birthday. But this next one would be it – unless she wanted to travel more.
Alaska was last year, Galapagos is this year, Africa the year after. “I met with a financial advisor who ran a Monte Carlo simulation,” she said, “if I save a little more and take vacations from my income rather than savings, it’s more likely I’ll be better off.”
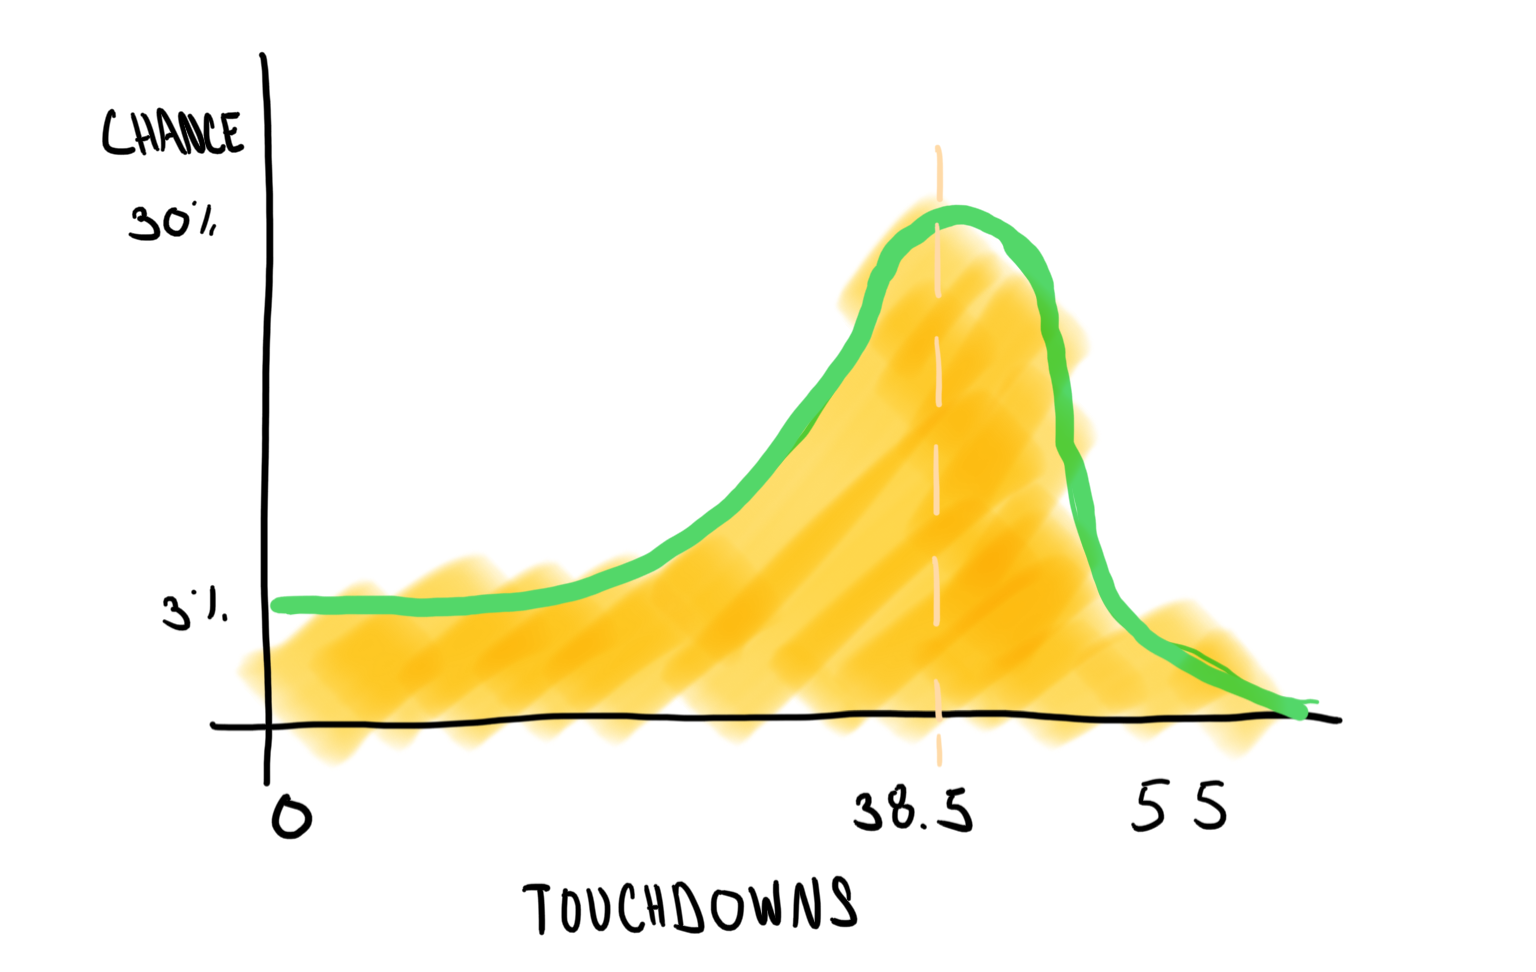
Monte Carlo simulations, I thought, that sounds like a task for an LLM. After entering some approximate figures and going back and forth, Gemini ended with this: The Median Outcome: Even with this safer spending, the median outcome is ending up with $10M+ at age 83. This highlights the “Saver’s Dilemma”—to guarantee you don’t run out of money in the worst 10% of scenarios, you usually end up with a massive surplus in the other 90%.
Humans are feeling creatures, and it was a good feeling to know the spending “floor”. (See also: Maxims for Thinking Analytically, extremes). In almost all situations $X is your spending floor.
Decisions are a constant tradeoff of: what kind of mistake are you willing to live with?
When I returned to teaching the cheating whack-a-mole was a whole new level. Twenty years ago laptops were a minority, now Chromebooks are ubiquitous.
Imagine you’re running a marathon against one other runner. You’re neck and neck through the first five miles. You pull ahead. But then you notice something. There’s another runner ahead. You misunderstood. You’re running a marathon against a relay team.
That’s the whack-a-mole challenge. Pop one area, a fresh one arises.
Teachers have the same choice as retirees running Monte Carlo simulations (and all of us!). What side do I error toward? There’s no bullseye because there’s no right answer, just blunders one way or another.
In the classroom, I give grace. Punishing a kid who worked hard and had questionable (LLM?) answers is worse than catching the number of cheaters +1. Retirees aim for grace too, only from the market.
It’s like an alarm system. Do you want it to go off at false alarms or miss real events?
This is the same spirit at the heart of 4000 Weeks – mistakes are inherent, are we choosing which ones to make?