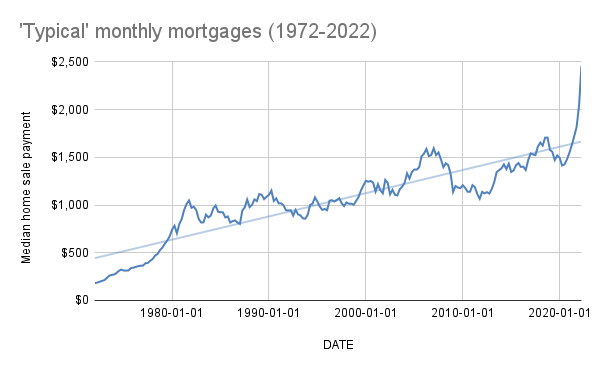
This is the ‘typical’ house payment for the last fifty years. ‘Typical’ being the median sale price and average thirty year rate.
If my parents had bought when I was born they paid $982. But if they bought when my brother was born, it would be almost two-hundred dollars less each month. A huge difference for a young family.
The sweet spot for modern buyers was October 2011 when payments flirted with $1,000.
The Covid-19 drop and surge can be seen toward the right. It wasn’t until August of 2021 that payments crossed the trend line into wild heights.
What difference does it make for someone now? Since the end of 2020, the ‘typical’ payment increased seven-hundred dollars a month.
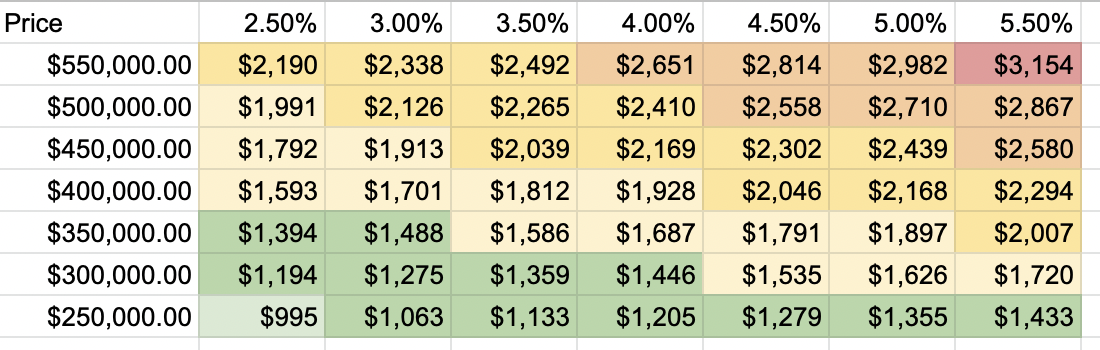
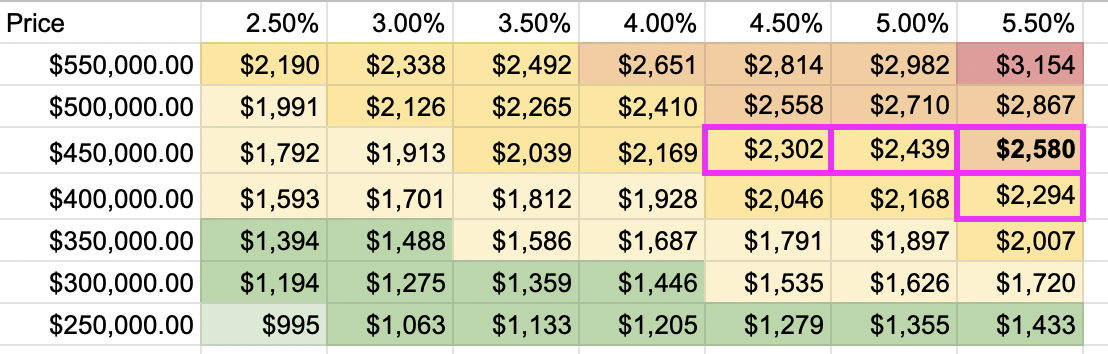
Interest rates are a headline metric, but are not the most important thing for buyers. The fall 2022 ‘typical’ monthly payment is: $2,580. A $50,000 decline on the purchase price is equivalent to 1% lower interest payments. Not only that, home prices have a .9 correlation with monthly payments whereas interest rates have a -.55 score.
Housing is easy news to consume. The bad is about rising prices and rates. The good is about remodels, flips, and luxury. The truth is somewhere in the middle, here it’s in color.
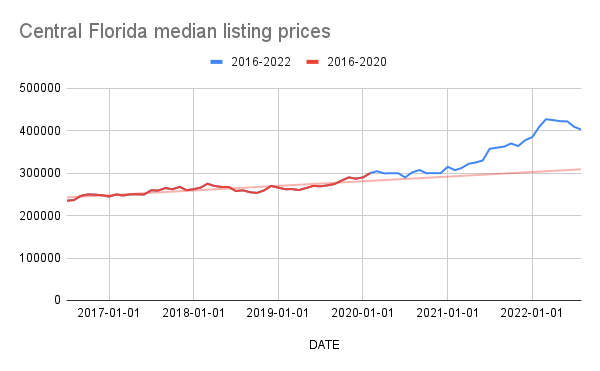
How “off track” are housing prices? The red line is the 2016- March 2020 trend line relative to the graph of median listing prices. Currently prices are a 33% premium to what the historical growth suggests.
…
United States figures only.
