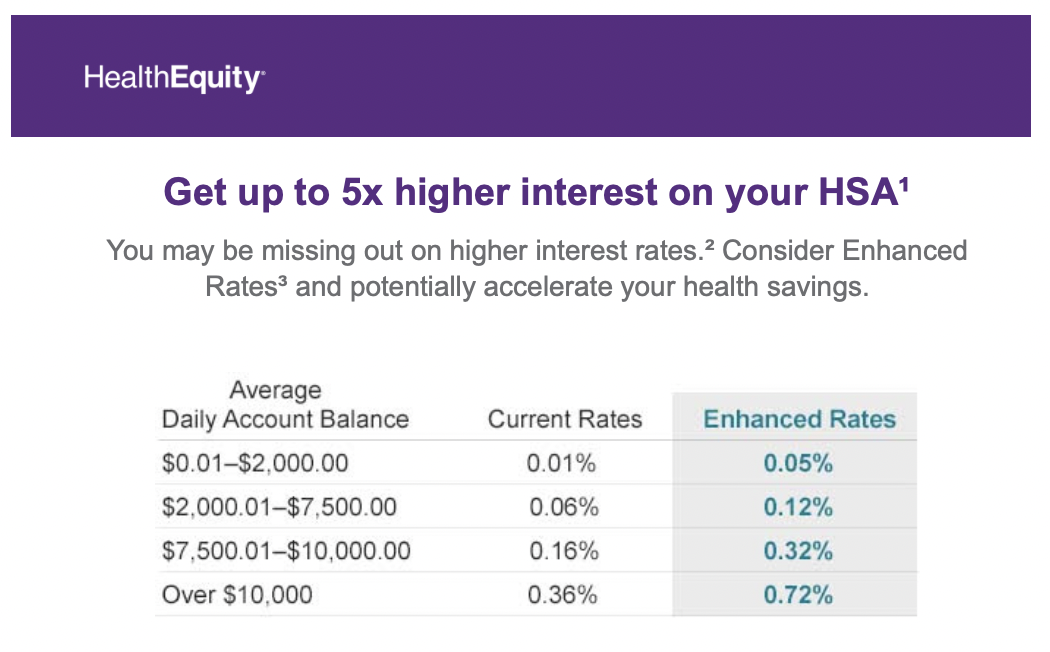
This is from our HSA. It’s good copywriting. ‘5X’ is easy to understand. ‘You may be missing out’ is great too.
The chart excels as well. It’s easy to understand and those Enhanced Rates do look bigger. They look bigger because of level one numeracy.
We level one think all the time. It’s knee jerk and first blush. We see something and some combination of evolution and experience fit what we see with what we know. Big red ‘Sale’ signs are examples. We first compare the sale price with the previous price rather than the item’s intrinsic value. This makes sense as our first reaction is immediate, requires no additional effort, and is something we are used to doing because it mostly works just fine.
The posts here, about average, focus on this idea too. Average is easy to compute and conveys certainty about an uncertain (often heterogeneous) world. Average is level one numeracy but we can do better.
One way to get past this reactionary thinking is to change the what we know part of our lives. Books like The Data Detective (2021), How to Lie with Statistics (2010), Fooled by Randomness (2008), and Factfullness (2018) are wonderful.
A fast fix comes from Sir David Spiegelhalter. Don’t look at relative comparisons, look at absolutes. Rather than the relative rate, look at the dollar difference.
That’s what I did.
If someone saves the $2,000 in an ‘enhanced’ HSA account they have sixteen more dollars after twenty years. A lot of years for not a lot of money. For accounts of ten-thousand dollars, the difference is almost eight hundred dollars ($11,543 vs $10,745). Fine, a Series I Savings Bond accrued that same dollar value in six months.
The don’t look at relative comparisons, look at absolutes is a good starting place – but there are further levels.
First is to think about the costs. The enhanced HSA rates are an annuity, likely with some new terms. There’s the switching costs too. That’s a potential headache and unwanted contract in exchange for not much money. We will pass.
Actual health rather than health savings is different.
For people 25-34, their chance of dying from Covid-19 is about the same as pulling the ace of spades from a shuffled deck – twice in a row.
For people 55-64, their chance of dying from Covid-19 is about the same as flipping heads eight times in a row.
For people 75-84, their chance of dying from Covid-19 is about the same as pulling any heart from a random deck of cards – three times in a row.
Those are low absolute risks but seriously consequential.
The world is complicated and messy. Not only that, but it changes too. Numbers are helpful, but we have to ask the right questions to start.
–
The Covid-19 odds are rough estimates. There are about forty million people in any ten year age group. The number of deaths in the 25-34 group is 11,451. I divided the deaths by size of the group to get the percent chance of death. Odds are multiplicative, three heads in a row are 12.5%, 0.5*0.5*05. Two ace of spaces are one in fifty-two times one in fifty two, or about 0.04%.
